Cellular Energy Metabolism Assays

Energy metabolism is a fundamental principle of biology: Every cell has a metabolic profile. Studying metabolic changes can help define the state of cellular differentiation, characterize the immune response or profile a cancer cell and determine how best to treat the disease.

Promega bioluminescent metabolite assays are an easy way to get a comprehensive view of cellular metabolism. Read on to learn about how you can use these simple, sensitive and scalable add-and-read assays to measure the metabolic pathways involved in glucose, amino acid and lipid metabolism.

Many researchers assay viability or toxicity alongside metabolic studies. Run in parallel, these assays can normalize results and confirm your cells are still alive after treatment.

Learn More in this On-Demand Webinar
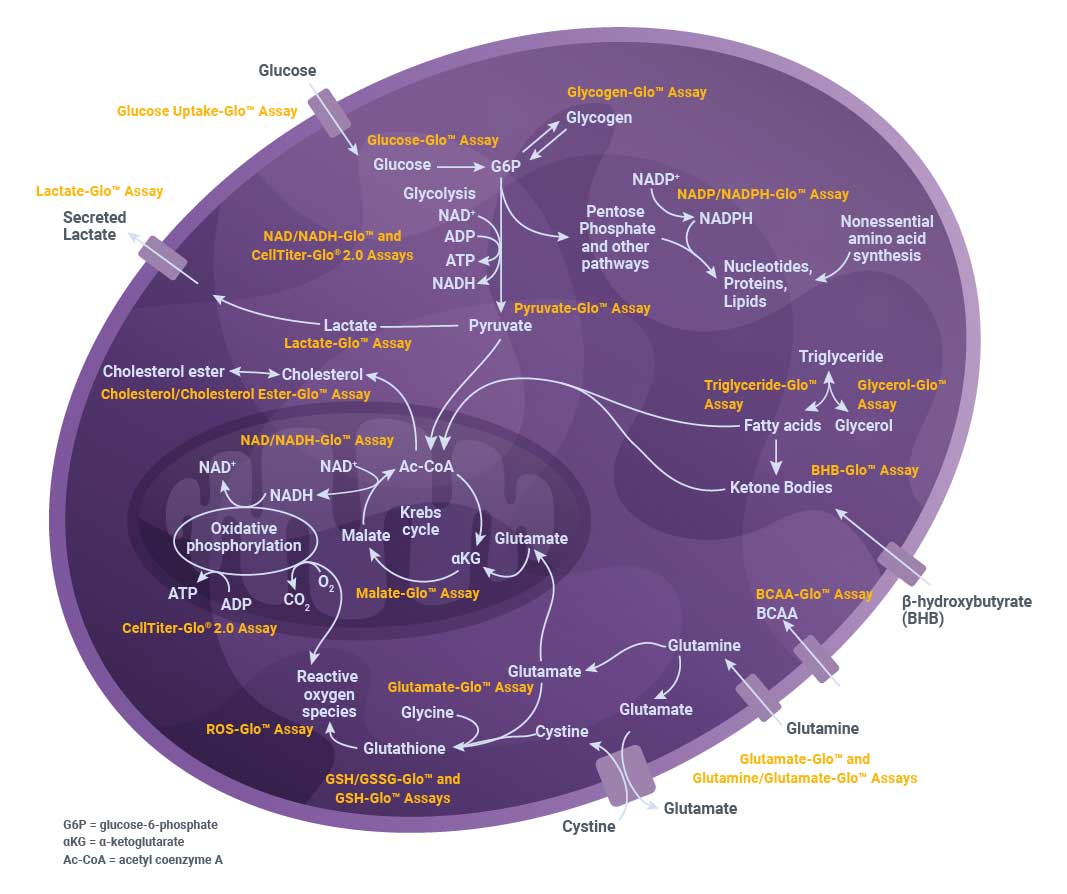
10-energy-metabolism-pathways-in-a-cell-mod-artboard-1-min

Cell Metabolism Pathways

Cellular energy metabolism is the consequence of dynamic interplay between many metabolic pathways. Promega offers sensitive, easy-to-use assay kits to monitor these pathways and related factors.

Available Assays

Looking for something not listed above? Try our DIY kits.

Learn about metabolism resources and applications for your area of interest:

Characterization of Metabolic Pathways

How to Measure Glycolysis

Glycolysis is the metabolic pathway that breaks down glucose, yielding pyruvate and energy in the form of ATP and NADH. Glucose is the primary fuel for all tissue types, and therefore glycolysis is used by all cells for energy production. In aerobic environments, pyruvate from glycolysis proceeds to the TCA cycle. When oxygen is limited, pyruvate is subsequently converted into lactate which is secreted.

Assays to use: Lactate-Glo™ Assay and Glucose-Glo™ Assay

See the data
18284ma
18285ma

Glycolysis is induced upon T-cell activation. Human peripheral blood T-cells in culture were activated with antibodies to CD3 and CD28 immobilized on magnetic beads. Small aliquots of media were removed over the course of a 96-hour incubation, and glucose consumption (orange) and lactate secretion (blue) were monitored by Glucose-Glo™ and Lactate-Glo™, respectively. The observed metabolic signature, with decreased glucose and increased lactate in the media, correlates to increased glycolytic activity in the T-cells. RLU, relative luminescence units.

How to Measure Glutaminolysis

Glutaminolysis is the metabolic pathway that breaks down glutamine into glutamate and subsequently, into TCA cycle metabolites. Glutamine is an abundant free amino acid in blood, and glutaminolysis can be elevated in cancer to support elevated biosynthesis and tumor growth.

Assay to use: Glutamine/Glutamate-Glo™ Assay

See the data
13954MA-W-a
13954MA-W-b

Elevated glutamine metabolism in cancer cells; as cells grow they continuously consume glutamine and secrete glutamate. SKOV-3 ovarian carcinoma cells were cultured for 48 hours. Two-microliter aliquots of media were removed at indicated time points. Glutamine consumption (blue) and glutamate secretion (yellow) were measured using the Glutamine/Glutamate-Glo™ Assay. The red line represents the luminescence values of the medium controls in RLU, relative luminescence units.

How to Measure Steatosis and Lipogenesis

Lipogenesis is the metabolic pathway that converts carbohydrate precursors into triglycerides, which are long-term energy storage molecules. Lipogenesis occurs primarily in adipocytes. Steatosis is the build-up of circulating triglycerides in hepatocytes, and is a hallmark of liver disease (NAFLD/NASH).

Assay to use: Triglyceride-Glo™ Assay

See the data
16243ma-w

Microtissues (InSphero) were incubated for 3 and 10 days in serum-free medium containing either physiological (LG/LI) or supraphysiological (LG/HI) levels of glucose and insulin and supplementation with either free fatty acids bound to BSA (FFA) or low-density lipoprotein plasma fraction (LDL). The microtissues were washed twice in PBS and assayed with the Triglyceride-Glo™ Assay. Values were plotted as concentration of triglyceride per microtissue (MT). The data were generously provided by InSphero, AG, Zurich, Switzerland.

How to Measure Lipolysis

Lipolysis is the metabolic pathway that breaks down triglycerides into fatty acids and glycerol. This pathway is used to release stored energy during fasting or prolonged exercise. Lipolysis occurs primarily in adipocytes.

Assay to use: Glycerol-Glo™ Assay

See the data
17133ma-w

Insulin-mediated inhibition of glycerol release in adipocytes. Adipocytes differentiated from 3T3-L1 MBX cells were treated with combinations of isoproterenol (25nM) and insulin (150nM). After 90 minutes of treatment, a sample of the media was removed from each well. Samples and glycerol standards were assayed using the Glycerol-Glo™ Assay. Each condition was tested in triplicate, and the error bars represent standard deviation. Glycerol release from adipocytes is a proxy for lipolysis. Here, isoproterenol-stimulated lipolysis was inhibited twofold by insulin.

How to Measure Insulin Action

Insulin is the hormone responsible for controlling energy storage after meals. Insulin acts by binding to receptors on cells to trigger glucose uptake, glycogen synthesis for short-term energy storage, and triglyceride synthesis for long-term energy storage. Diabetes mellitus results when insulin action does not occur properly (either the body does not produce enough insulin, or the body does not respond to insulin).

Assays to use: Glucose Uptake-Glo™ Assay + Triglyceride-Glo™ AssayGlycogen-Glo™ Assay

See the data

Featured citation:

Inhibition of the Monocarboxylate Transporter 1 (MCT1) Promotes 3T3-L1 Adipocyte Proliferation and Enhances Insulin Sensitivity. Bailey, et al. International Journal of Molecular Sciences. 2022, 23(3), 1901.

Using Promega assays, the authors measure glucose uptake and triglyceride content of 3T3-L1 cells following insulin stimulation. Read the paper: https://doi.org/10.3390/ijms23031901

Combining Assays

Monitoring Multiple Metabolic Pathways at Once

By analyzing multiple metabolites in parallel from your samples, you can get a comprehensive understanding of which metabolic pathways are most active in your model system.

Featured citation: Pathway-based classification of glioblastoma uncovers a mitochondrial subtype with therapeutic vulnerabilities.

Work from Garofano, et al. published in Nature Cancer characterizes glioblastoma subtypes. Using single cell RNA-seq, four unique tumor subtypes were determined based on cellular metabolic and developmental features. Then, six different Promega metabolite assays were used to empirically validate the active metabolic pathways in patient-derived cell models for each subgroup (including glucose uptake, glycolysis, glutaminolysis, lipid metabolism and oxidative stress). Metabolic profiling was also used to test the efficacy of drugs for tumor subtypes.

featured-citation