How to Optimize RT-qPCR using the PCR Optimization Kit
Promega Corporation
Publication Date: 11/2017
Abstract
Successful RT-qPCR is dependent on an optimal combination of chemistry, primers and target and cycling parameters. The PCR Optimization Kit provides a range of buffer formulations that make it easy to determine optimal amplification conditions. With the addition of GoScript® Reverse Transcriptase and RNasin® Ribonuclease Inhibitor, these buffers can also be used to optimize RT-qPCR conditions. This article provides a protocol for RT-qPCR optimization using the buffers supplied in the PCR Optimization Kit, and provides example optimization data.
Methods
Materials Required:
- PCR Optimization Kit (Cat.#): The PCR Optimization Kit contains PCR Buffers A-H, MgCl2, Nuclease-free water, and GoTaq® MDx Hot Start Polymerase.
- GoScript® RT Mix for 1-Step RT-qPCR , which includes Recombinant RNasin® Ribonuclease Inhibitor, and the dsDNA binding dye BRYT Green. GoScript® RT Mix for 1-Step RT-qPCR is supplied in the GoTaq® Probe 1-Step RT-qPCR System (Cat.# A1620).
- Primers for the target of interest .
- If using a real-time instrument requiring passive reference dye, your will also need CXR (Promega #C541A; supplied in the GoTaq® Probe 1-Step RT-qPCR System (Cat.# A1620).
PCR Buffers A-H were tested for amplification of a 139bp beta-2 microglobulin target (B2M, NM_004048.2) from serially diluted human total RNA using dye-based 1-Step RT-qPCR. Each 5X PCR Buffer (containing dNTPs) was used to prepare an intermediate 2X master mix containing polymerase, reverse transcriptase, MgCl2, and fluorescent dyes, to model a custom master mix. Final 1X reaction components included 1X PCR Buffer, 0.05U/μL GoTaq® Hot Start Polymerase, 0.2U/μL GoScript® Reverse Transcriptase, 1U/μL Recombinant RNasin® Ribonuclease Inhibitor, 2mM MgCl2, 1X BRYT® Green Dye, 30nM CXR (passive reference dye) and 200nM forward and reverse primers in a 25μL reaction. B2M primer sequences are (F) AAAGCAAGCAAGCAGAATTTGG and (R) GTATGCCTGCCGTGTGAAC (BioSearch Technologies), and were shown to be specific to a 139bp target in the human RefSeq mRNA database using Primer-Blast1. The only match within the genome reference assembly is > 2000bp and is unlikely to amplify.
Optimum reaction conditions and cycling parameters depend on the combination of chemistry, primers and target.
Human Total RNA (Agilent QPCR Human Reference Total RNA) was serially diluted 5-fold from 25ng – 1.6pg per reaction in Nuclease-Free Water. All samples and no-template controls were amplified in quadruplicate reactions on a 7500 Fast Real-Time PCR System (Applied Biosystems) in fast mode with the following cycling conditions: 15 min at 37°C; 10 min at 95°C; 40 cycles of 10 sec at 95°C, 1 min at 62°C; default dissociation (melt curve). Optimum reaction conditions and cycling parameters depend on the combination of chemistry, primers, and target. Optimum conditions for other assays may differ from the conditions used in this report.
Data were analyzed using 7500 Software v 2.0.6 (Applied Biosystems) with automatic baseline and threshold methods except as indicated. Baselines were verified using the linear amplification view, while thresholds were verified using the semi-log amplification view. Assay linearity and efficiency were assessed for the standard curve of RNA serial dilutions.
Results
Promega PCR Optimization Kit Buffers A-H were tested for their ability to support 1-Step RT-qPCR under typical user conditions. All eight PCR Buffers supported amplification at all RNA concentrations tested. Amplification in no-template control reactions was seen only with PCR Buffer H, and likely represents primer artifacts (e.g., primer-dimer) as indicated by the low product melting temperature (Figure.1).
Automatic baseline and threshold values were determined by the 7500 Software for each buffer tested with the following exceptions: For PCR Buffer G, the software-determined baseline settings for one NTC reaction were manually increased from cycles 1–3 to cycles 3–15, consistent with typical baseline settings. For PCR Buffer H, the software-determined threshold setting was used but is at the very low end of the exponential phase, apparently caused by the non-specific amplification in NTC wells.
Threshold values are expected to change with dye, chemistry and assays used, so each experiment must be analyzed separately for appropriate quantitation. Assays were linear between 1.6pg and 25ng of RNA, as indicated by R2 values ≥ 0.980 in all eight PCR Buffers. Assay efficiency was within the recommended range of 90–110% in seven of the eight buffers (2).
Melt analysis demonstrated a single melt peak in each buffer, consistent with specific amplification of a single product (aside from primer artifacts in PCR Buffer H NTC reactions). Within any given buffer, melting temperatures vary by ≤ 0.16% CV. However, the melting temperature of an identical product is expected to vary between buffers, due to the influence of PCR buffer salts and additives on DNA duplex stability. Melting temperatures for each buffer are given in Table 1, and range from as low as 77.17°C in PCR Buffer F to 82.75°C in PCR Buffer D. Generally, product melting temperature shifts are expected to mimic oligo annealing temperature shifts. The low melting temperature of the product in PCR Buffer F may indicate reduced DNA duplex stability. Optimization of the assay in this particular buffer would therefore start with testing of reduced oligo annealing temperatures in qPCR cycling.
The melting temperature of a single product is expected to vary between buffers, due to the influence of PCR buffer salts and additives on DNA duplex stability.
Table 1. Summary statistics for 1-Step RT-qPCR of a 139bp B2M amplicon using PCR Buffers A-H.
| Specificity | Linearity | Sensitivity | Efficiency | ||||
|---|---|---|---|---|---|---|---|
| NTC | Product Tm, °C (%CV) | R2 | Cq (Std) of 1.6pg | Y-Intercept | (Slope) | Threshold | |
| PCR Buffer A | 0/4 | 80.97 (0.16) | 0.998 | 33.45 (0.15) | 33.84 | 102% (-3.29) | 3.09 |
| PCR Buffer B | 0/4 | 80.13 (0.16) | 0.998 | 33.69 (0.32) | 34.20 | 94% (-3.47) | 3.11 |
| PCR Buffer C | 0/4 | 81.46 (0.16) | 0.995 | 32.75 (0.21) | 33.26 | 94% (-3.49) | 3.14 |
| PCR Buffer D | 0/4 | 82.75 (0.15) | 0.997 | 31.90 (0.12) | 32.37 | 106% (-3.20) | 3.04 |
| PCR Buffer E | 0/4 | 80.58 (0.16) | 0.999 | 32.56 (0.16) | 33.12 | 102% (-3.27) | 1.92 |
| PCR Buffer F | 0/4 | 77.17 (0.11) | 0.997 | 33.45 (0.15) | 34.08 | 87% (-3.67) | 1.82 |
| PCR Buffer G | 0/4 | 80.11 (0.12) | 0.999 | 31.41 (0.10) | 32.04 | 102% (-3.27) | 2.66 |
| PCR Buffer H | 2/4* | 79.49 (0.12) | 0.997 | 28.00 (0.24) | 28.43 | 101% (-3.30) | 0.15 |
*Non-specific amplification, indicated by broad, low-Tm peak in the melting profile. Cq values are > 8 cycles later than 1.6pg standards.
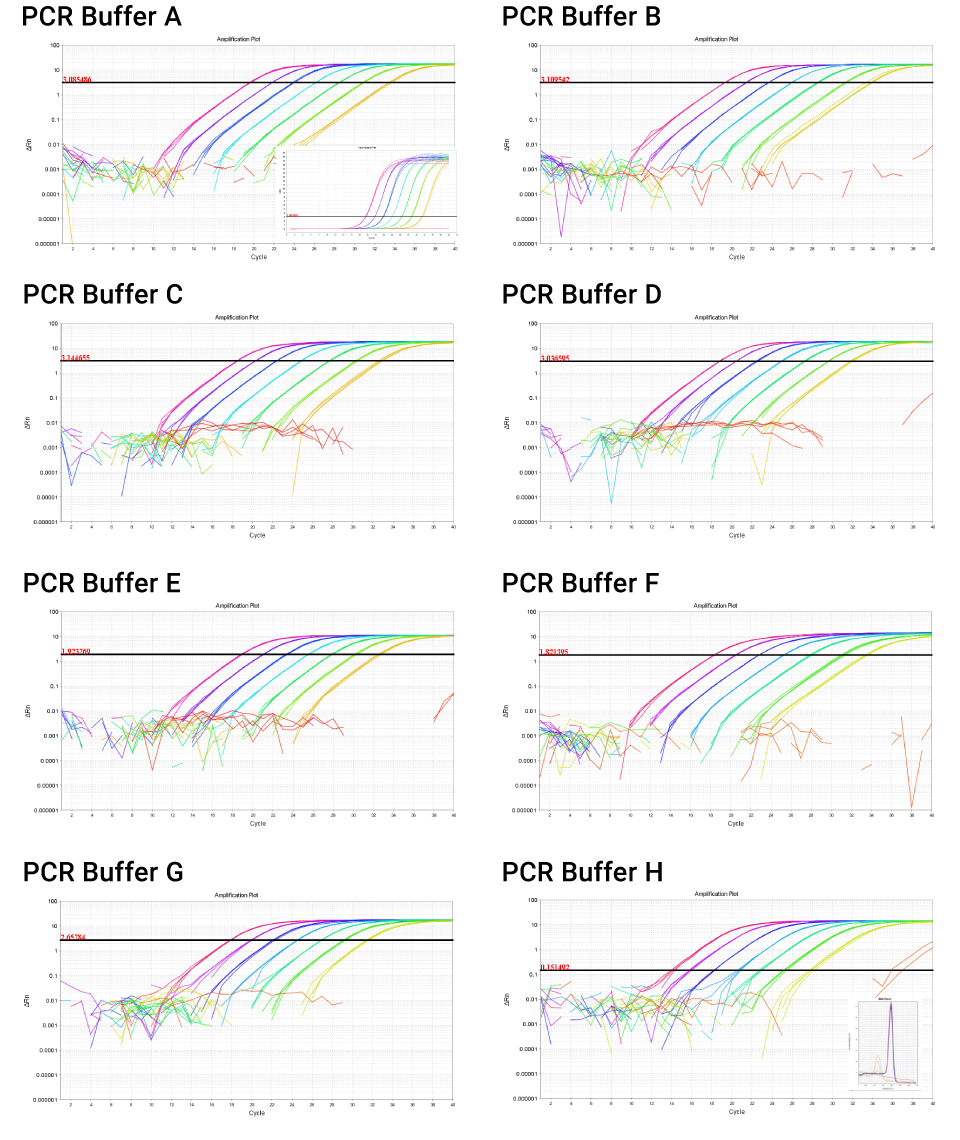
Figure 1. Semi-log amplification plots for 1-Step RT-qPCR amplification of the B2M target from serially diluted human RNA in PCR Buffers A-H. Software-determined thresholds are indicated with the horizontal black line. An example linear amplification plot is shown as an inset for PCR Buffer A. NTC reactions (2 of 4 reactions) in PCR Buffer H show non-specific amplification as indicated by the low melting temperature (red traces, inset melt curve).
Conclusions
The PCR Optimization Kit offers a breadth of buffer formulations appropriate for diverse endpoint and real-time PCR applications that can be used for manufacture of custom master mixes.
References
- Ye, J. et al. (2012) Primer-BLAST: a tool to design target-specific primers for polymerase chain reaction. BMC bioinformatics 13, 134, doi:10.1186/1471-2105-13-134.
- Bustin, S.A. et al. (2009) The MIQE guidelines: minimum information for publication of quantitative real-time PCR experiments. Clinical chemistry 55, 611-622, doi:10.1373/clinchem.2008.112797.