How to Measure Cellular Metabolism
Explore our easy-to-use bioluminescence assays to measure metabolic activity, including glucose uptake, lactate, glutamine, oxidative stress and dinucleotide detection assays.
Simon Moe, Promega Corporation
Publication date: December 2024
Introduction
Cellular metabolism encompasses the complex network of chemical reactions occurring within cells to sustain life. It is responsible for producing and regulating cellular energy, synthesizing essential biomolecules, and maintaining homeostasis. Specific metabolites can act as markers for pathway activity or larger functional processes and provide relevant information to understand disease mechanisms, develop drugs, and discovery biomarkers.
Studying cellular metabolism requires methods that are both easy to use and reliable. Bioluminescence-based assays offer a sensitive, fast, and accurate way to measure signals linked to specific cellular processes. Our assays utilize metabolite-specific dehydrogenases to produce a luminescent signal directly proportional to the metabolite concentration in the sample. This allows you to measure metabolic activity in cell culture media, plasma, serum, cell lysates, cultured cells and tissues. These assays generate quantitative signal within 60 minutes, allowing for high-throughput compatible measurement on a luminometer.

Principle of luminescence assays based on metabolite-specific dehydrogenase reduction. Bioluminescence is generated proportionate to the amount of relevant metabolite in the sample. This schematic represents our Metabolite-Glo® Detection System.

Workflow of cellular metabolism assays. Detection of metabolites in samples can be performed in ~60 minutes on a luminometer, such as the GloMax® Discover.
These assays measure metabolites directly, allowing you to detect relevant metabolic processes from the cell supernatant without lysing the cell. This makes our assays highly suitable for analysis of 3D cell culture models.
Our comprehensive portfolio of metabolic activity assays facilitates detailed analysis of metabolism, providing valuable insights into cell health.
How to Measure Glycolysis/Warburg Effect
Glycolysis is a fundamental metabolic pathway that converts glucose into pyruvate, yielding energy in the form of ATP and NADH. As the primary source of energy, glucose fuels all cell types, making glycolysis a universal pathway. Under aerobic conditions, pyruvate progresses to the TCA cycle for further energy extraction. In low-oxygen conditions, however, pyruvate is converted into lactate and secreted by the cell.
Understanding glycolysis requires monitoring multiple metabolite levels. Aerobic glycolysis, also known as the Warburg Effect, is a well-known metabolic shift in cancer cells in which glycolysis is preferred over oxidative phosphorylation.
Key Metabolic Indicators:
- Glucose (Glucose-Glo™ Assay)
- Lactate (Lactate-Glo™ Assay)
- Pyruvate (Pyruvate-Glo™ Assay)
Example: Glycolysis Measurement in Activated T-Cells
Experimental setup
Peripheral blood T-cells were activated in culture using CD3 and CD28 antibodies on magnetic beads.
Monitoring Glucose and Lactate Over Time
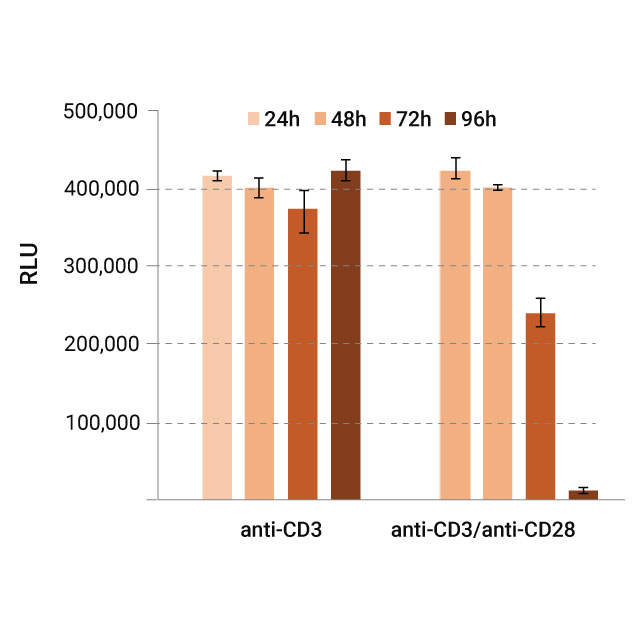
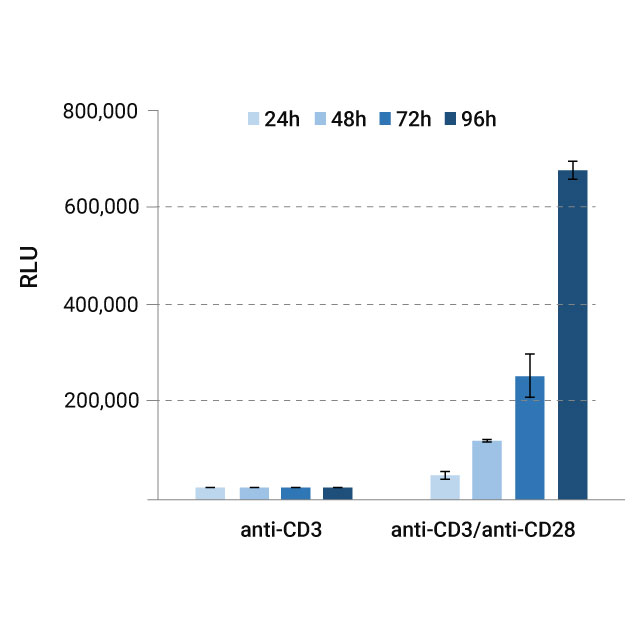
Aliquots of cell media were taken periodically over a 96-hour incubation period, with glucose and lactate levels measured using Glucose-Glo™ (left graph) and Lactate-Glo™ (right graph) Assays. Results were read on a GloMax® microplate reader and reported in relative luminescence units (RLU).


Results & Conclusion
The observed data indicated decreased glucose (left) and increased lactate (right) in the media, consistent with elevated glycolytic activity upon activation of T-cells. These results provide a quantifiable measure of metabolic shifts in T-cells over time. Our bioluminescent assays provide a way to make these measurements in a nondestructive manner.
Related References
Learn more about the development of our assays in this publication: "Bioluminescent Assays for Glucose and Glutamine Metabolism: High-Throughput Screening for Changes in Extracellular and Intracellular Metabolites"How to Measure Glutaminolysis
Glutaminolysis is a key metabolic pathway that breaks down glutamine into glutamate, which is subsequently converted into intermediates for the TCA cycle. As the most abundant free amino acid in blood, glutamine serves as a significant energy and biosynthetic resource for cells.
In cancer cells, glutaminolysis is often upregulated to support rapid cell growth and biosynthesis, aiding tumor progression by fueling biosynthetic pathways. Monitoring glutaminolysis within these cancer cells can provide insights into potential therapeutic targets.
Key Metabolic Indicators:
- Glutamate (Glutamate-Glo™ Assay, Glutamine/Glutamate-Glo™ Assay)
- Glutamine (Glutamine/Glutamate-Glo™ Assay)
Example: Glutaminolysis Measurement in SKOV-3 Cancer Cells
Experimental Setup
SKOV-3 ovarian carcinoma cells were plated at 5,000 (light blue and yellow bars) and 20,000 (dark blue and yellow bars) cells/well and cultured for 48 hours to monitor their glutamine metabolism.
Glutamine and Glutamate Monitoring
Small aliquots (2µl) of culture media were taken every 12 hours over 2 days. Glutamine consumption (left graph) and glutamate secretion (right graph) were measured using the Glutamine/Glutamate-Glo™ Assay. Results were read on a GloMax® microplate reader and reporter in relative luminescence units (RLU).


Results & Conclusion
The results indicated a continuous consumption of glutamine with a corresponding increase in glutamate secretion, reflecting increased glutaminolysis. The red line shows the baseline luminescence values of the media controls (RLU), providing a reference for metabolic changes over time.
Related References
Learn more about the development of our assays in this publication: "Bioluminescent Assays for Glucose and Glutamine Metabolism: High-Throughput Screening for Changes in Extracellular and Intracellular Metabolites"How to Measure Steatosis and Lipogenesis
Lipogenesis is the metabolic process that synthesizes triglycerides from carbohydrate sources, creating long-term energy stores within adipocytes (fat cells). In contrast, steatosis refers to the accumulation of triglycerides in liver cells (hepatocytes), often associated with liver diseases such as metabolic dysfunction-associated fatty liver disease (MAFLD) and non-alcoholic steatohepatitis (NASH).
Understanding lipogenesis and steatosis is crucial in studying metabolic disorders and liver diseases, as excess triglyceride storage in the liver can lead to cellular stress, inflammation, and disease progression. Lipid metabolism relies on triglyceride, thus treatments and environmental conditions that impact lipid metabolism can result in excess triglyceride accumulation in cells.
Key Metabolic Indicators:
- Triglyceride (Triglyceride-Glo™ Assay)
Example: Triglyceride Accumulation in Microtissues with Varying Glucose and Lipid Conditions
Experimental Setup
3D human liver (provided by InSphero) were cultured in a serum-free medium for either 3 or 10 days, with differing concentrations of glucose and insulin (physiological LG/LI vs. supraphysiological LG/HI) as well as fatty acid sources (either free fatty acids bound to BSA or LDL plasma fractions).
Sample Processing and Assay
After the incubation period, the microtissues were washed in PBS to remove residual media and then analyzed using the Triglyceride-Glo™ Assay to measure triglyceride levels per microtissue (MT). Results were read on a GloMax® microplate reader and reported in relative luminescence units (RLU).

Results & Conclusion
Data indicate triglyceride concentrations in each microtissue, with variation depending on the glucose, insulin, and fatty acid conditions. This data shows how different metabolic conditions influence triglyceride accumulation, which is relevant to studies on lipogenesis and steatosis. Data generously provided by InSphero, AG, Zurich, Switzerland.
Related Resources
Learn more in this article: "Homogeneous Assays For Triglyceride Metabolism Research"
How to Measure Lipolysis
Lipolysis is the metabolic pathway through which triglycerides are broken down into free fatty acids and glycerol, releasing stored energy. This process is primarily activated during fasting or prolonged exercise, providing essential energy from adipose tissue (fat stores).
Lipolysis predominantly occurs in adipocytes (fat cells), where stored triglycerides are hydrolyzed in response to energy demands. Understanding lipolysis is vital for studying metabolic responses to fasting, exercise, and hormonal regulation. It is also relevant for conditions like obesity and metabolic disorders, where dysregulated lipolysis can impact health.
Key Metabolic Indicators:
- Glycerol (Glycerol-Glo™ Assay)
Example: Insulin-Mediated Inhibition of Lipolysis in Adipocytes
Experimental Setup
Adipocytes derived from 3T3-L1 MBX cells were treated with isoproterenol (25nM) to stimulate lipolysis. Insulin (150nM) was then added to test its inhibitory effect on glycerol release.
Sample Collection and Assay
After 90 minutes of treatment, media samples were collected from each well. Samples, along with glycerol standards, were assayed using the Glycerol-Glo™ Assay to measure glycerol release as a proxy for lipolysis. Each condition was tested in triplicate to ensure data reliability, and standard deviation was represented by error bars. Results were read on a GloMax® microplate reader and reported in relative luminescence units (RLU).

Results & Conclusion
Results showed that isoproterenol significantly stimulated glycerol release (lipolysis), while insulin inhibited this effect by approximately twofold, demonstrating its regulatory role in suppressing lipolytic activity in adipocytes.
How to Measure Insulin Action
Insulin is a vital hormone that regulates energy storage and utilization after meals. Insulin binds to receptors on cell surfaces, thereby triggering processes such as increased glucose uptake, glycogen synthesis for short-term energy storage, and triglyceride production for long-term energy storage. These mechanisms ensure that excess nutrients from meals are stored for future use, maintaining the body's energy balance.
To fully understand insulin’s role, it is important to assess multiple metabolic endpoints, including glucose uptake, glycogen synthesis, and triglyceride synthesis. These indicators reveal how effectively cells respond to insulin and manage energy storage. Performing these assays in parallel provides a comprehensive view of insulin’s metabolic impact.
Insulin’s regulation of energy storage is essential for maintaining normal blood glucose levels and overall metabolic health. When insulin action is impaired, as in diabetes mellitus, energy storage and utilization become dysfunctional, leading to elevated blood glucose and lipid levels and disrupting metabolic homeostasis.
Key Metabolic Indicators:
- Glucose (Glucose Uptake-Glo™ Assay)
- Glycogen (Glycogen-Glo™ Assay)
- Triglyceride (Triglyceride-Glo™ Assay)
Example: Stimulation of Glucose Uptake in Adipocytes by Insulin
Experimental Setup
In this study, the translocation of GLUT4 glucose transporters to the cell membrane was measured in 3T3-L1 MBX adipocytes upon insulin stimulation. Insulin binding triggers GLUT4 translocation, leading to an increase in glucose uptake, a critical process for energy storage in adipose cells.
Insulin Stimulation and Glucose Uptake Measurement
When treated with insulin, 3T3-L1 MBX adipocytes exhibited up to tenfold increase in glucose uptake, as quantified using the Glucose Uptake-Glo™ Assay. The assay’s sensitivity allowed for precise determination of insulin's half-maximal effective concentration (EC50) at 0.1nM, demonstrating its potency in stimulating glucose uptake.

Inhibition of Glucose Uptake by PI3K Inhibitor LY294002
To further investigate the signaling pathway involved in insulin-mediated glucose uptake, cells were treated with the PI3K inhibitor LY294002 for 30 minutes, followed by exposure to 100nM insulin for 1 hour. This inhibitor blocks a key step in the insulin signaling pathway, thus reducing glucose uptake. Viability was measured using the CellTiter-Glo® Luminescent Cell Viability Assay.

Results & Conclusion
This application demonstrates the effectiveness of the bioluminescent Glucose Uptake-Glo™ Assay in quantifying insulin-stimulated glucose transport in adipocytes and evaluating the efficacy of signaling pathway inhibitors. The results show that the assay sensitively detects glucose uptake in response to both hormonal stimulation and pharmacological inhibition, making it a valuable tool for studying insulin signaling in metabolic and pharmacological research.
Related References
See more data in this poster: "Bioluminescent Assays for Investigating Insulin Action and Steatosis"
Related Products
Interested in directly measuring insulin or glucagon? Explore our Lumit® Insulin and Glucagon Immunoassays.
How to Measure Glycogen Metabolism
Glycogen is a polysaccharide that serves as a form of short-term energy storage, primarily in the liver and muscles. The balance between glycogen synthesis (glycogenesis) and glycogen breakdown (glycogenolysis) is essential for maintaining stable blood glucose levels, especially during fasting or exercise. Insulin promotes glycogen synthesis after meals, while glucagon stimulates glycogen breakdown during fasting. This regulation of glycogen metabolism ensures a readily available source of glucose to meet the body’s energy needs.
Liver glycogen stores play a crucial role in maintaining blood glucose homeostasis. Dysregulation of glycogen metabolism is associated with metabolic disorders such as diabetes and non-alcoholic fatty liver disease (NAFLD). Monitoring glycogen levels in liver models can provide insights into how metabolic conditions and treatments affect energy storage and release.
Key Metabolic Indicator:
- Glycogen (Glycogen-Glo™ Assay)
Example: Glycogen Metabolism in 3D Liver Microtissues
Experimental Setup
3D human liver microtissues were treated for 7 days with high glucose and high insulin (HGHI) to model de novo lipogenesis (DNL) or with high glucose, high insulin, and free fatty acids (HGHI + FFA) to model steatosis.
Glycogen Starvation and Glucagon Response
After a 24-hour starvation period, liver microtissues were treated with either glucagon or a control for an additional 24 hours. In both the DNL and steatosis models, glucagon treatment stimulated glycogenolysis, resulting in decreased glycogen levels.

Results & Conclusion
The data, based on three independent experiments, show how glycogen metabolism responds to hormonal stimulation. As expected, glucagon stimulated glycogenolysis and decreased glycogen levels in both the DNL and steatosis models. This provided insights into how liver cells regulate glycogen stores under different metabolic conditions.
Related References
See more data in this poster: Bioluminescent Tools for Functional Characterization of Liver Models
How To Measure Branched Chain Amino Acid Metabolism
Amino acids are essential building blocks for protein synthesis and play critical roles in various metabolic pathways. Beyond their structural functions, amino acids—particularly branched-chain amino acids (BCAAs) like leucine, isoleucine, and valine—contribute to energy production and cellular signaling, especially during metabolic stress or nutrient scarcity.
Alterations in amino acid metabolism, including BCAA metabolism, are associated with metabolic disorders like diabetes. Elevated BCAA levels have been linked to insulin resistance and are frequently observed in individuals with Type I or Type II diabetes.
Key Metabolic Indicator:
- Branched chain amino-acids (BCAA-Glo™ Assay)
Example: Detection of BCAA in Urine Samples from Diabetic and Non-Diabetic Individuals
Urine Sample Analysis for BCAA
Urine samples offer a non-invasive method for assessing amino acid metabolism. Monitoring BCAA levels in urine can reflect systemic metabolic changes and offers a practical approach for large-scale studies on metabolic health.
Sample Collection and Preparation
Urine samples from presumed non-diabetic individuals and individuals with Type I or Type II diabetes were diluted (1:16 or 1:32 in 1X PBS). The assay protocol involves diluting urine samples in phosphate-buffered saline (PBS) and using a 7-point leucine standard dilution series for quantification. BCAA levels are calculated by comparing luminescent signals to the standard curve, then applying a dilution factor to obtain corrected concentrations. Samples were assayed using the BCAA-Glo™ Assay. Luminescence was read on a GloMax® microplate reader and reported in relative luminescence units (RLU).

Results & Conclusion
BCAA concentrations were calculated from luminescent readouts, corrected for dilution, and expressed as mean values from duplicate assays for each individual (N=4). The data indicated variations in BCAA levels across samples, highlighting potential metabolic differences between diabetic and non-diabetic individuals.
Related References
See the protocol and data in this application note: Detection of Branched-Chain Amino Acids (BCAA) in Urine
Metabolic Activity Assays
Explore our easy-to-use bioluminescence assays to measure metabolic activity, including glucose uptake, lactate, glutamine, oxidative stress and dinucleotide detection assays.
Related Resources

Immuno-oncology Solutions
Explore our solutions to support research in immuno-oncology.
Diabetes Research Solutions
Learn about assays and technologies to advance understanding and treatment of diabetes.