Mixture Interpretation: Why is it Sometimes So Hard?
Consultant in Human DNA Identification Testing Gaithersburg, Maryland, USA
Publication Date: 2011
- the DNA is from only two sources; and
- the two sources are unrelated and have no or few shared alleles; and
- the ratio of the amount of DNA contributed by each of the two sources is adequate for interpretation of both sources; and
- the appropriate amount of DNA was amplified, resulting in all alleles for both sources being above the analytical threshold for the laboratory; and
- no degradation, inhibition or primer mutation variants, etc., are present to affect peak heights and the apparent DNA ratio; and
- all stutter peaks and any other artifacts are below the analytical threshold or clearly distinguishable as artifacts.
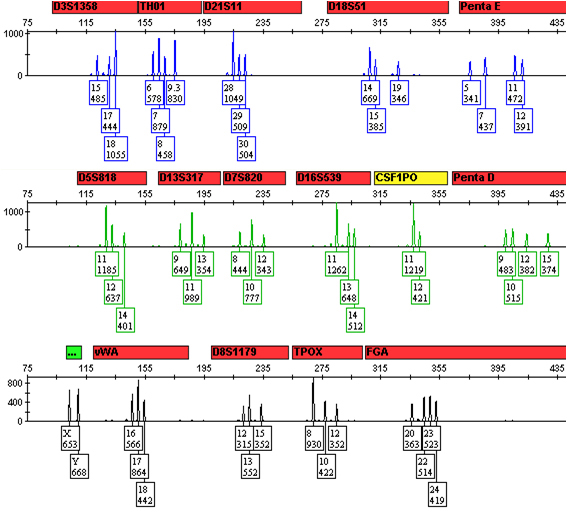
A DNA profile from such a scenario is shown in Figure 1. Here there are no more than four alleles at any locus, and peak height ratios are consistent with only two sources at all loci (e.g., fairly balanced and uniform peak height ratios at loci with four alleles and altered peak height ratios consistent with shared alleles at all loci with two or three alleles). It is thus reasonable to assume that there are only two sources of DNA in this profile. DNA analysts can interpret these data and calculate statistical frequencies with great confidence.
 Figure 1. A 1:1 mixture of DNA from two sources.
0.5ng of total DNA from a 1:1 mixture of DNA from two sources was amplified with the Promega PowerPlex® 16 HS System. One microliter of amplified product in 10µl of Hi-Di™ formamide/ILS was injected on an Applied Biosystems 3130xl Genetic Analyzer, and the data were analyzed using GeneMapper® ID-X. All alleles from both sources are present.
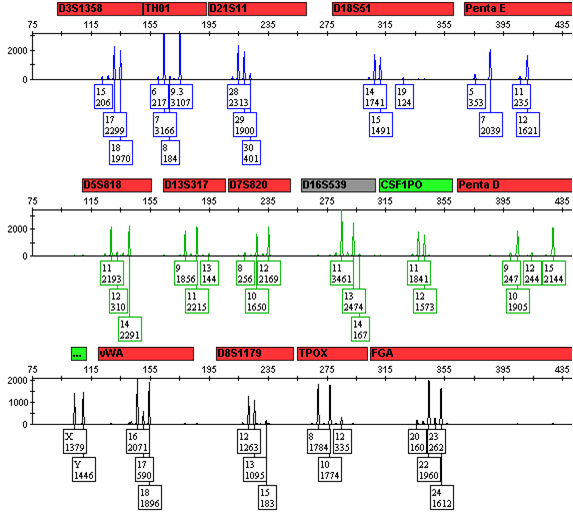
As the difference in the amount of the DNA contributed by the two sources increases, there becomes a point at which a clear major profile emerges that for all purposes can be treated as a single-source profile for interpretation and statistical calculations—the simplest scenario (Figure 2). Under this situation, the minor contributor’s profile also may be complete and easily interpreted (with the possible exception of shared alleles) or may be incomplete and more difficult to interpret as the disparity in the amounts of DNA from the two sources increases and alleles drop below the analytical and/or stochastic thresholds.
 Figure 2. A 9:1 mixture of DNA from two sources.
0.5ng of total DNA from a 9:1 mixture of DNA from the same two sources as in Figure 1 were amplified with the Promega PowerPlex® 16 HS System and processed as in Figure 1. All alleles from both the major DNA source and minor DNA source are present.
In many cases, minor alterations in one or more of the parameters listed in the first paragraph may have a minimal effect on the ability to confidently interpret a mixed DNA profile, especially if the amount of each DNA amplified is sufficient. Some three-person mixtures can be fairly easy to interpret, particularly if the individuals are unrelated and have few alleles in common and there are two “major” sources. Interpretation becomes even simpler if one of the sources is known (e.g., fluid and/or cells, fingernail or swab taken from an individual) and the profile from that individual can be removed easily, leaving two decipherable profiles. Limited degradation that only affects one or a few of the loci with the longest DNA sequences may have little effect on interpretation, particularly if the data from those loci can be recovered by a second amplification with more of the same DNA or by using mini-STRs. A single stutter peak or artifact generally has no impact on interpretation of the DNA profile(s) from the major source(s). On the other hand, significant alterations to any of the parameters listed (e.g., increasing the relatedness or number of alleles shared among the sources, increasing the number of contributors and/or the disparity in the amount of DNA from each source, an increase in the amount of degradation and/or presence of artifacts) will likely make mixture interpretation more complex; a combination of several alterations generally confounds the interpretation significantly.
The most problematic scenario for mixture interpretation, however, is when the amount of DNA amplified is limiting for one or more of the sources in a mixture. Interpretation of the DNA profile from the limited source(s) can become difficult to impossible due to the inability to confidently detect stochastic effects that may be present. Stochastic effects can result in any of the following observations in the mixed DNA profile:
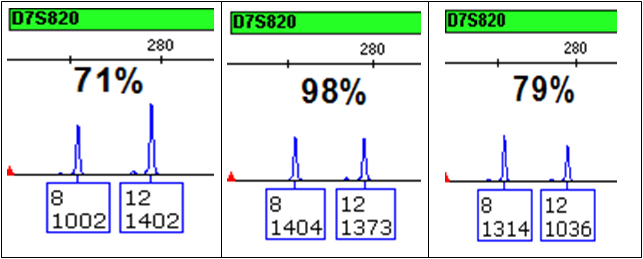
- extreme peak height imbalance due to the unequal presence and/or amplification of alleles from each source. This imbalance, which may be compounded by variation in pipetting and/or electrokinetic injection, appreciably affects one’s ability to calculate an accurate ratio of DNAs in the mixture. As a result, it becomes difficult to correctly associate alleles [and thereby “restrict” genotypes (1)] for individuals within a locus or across loci in a profile, especially since the number of sources that contributed to the mixed DNA sample is unknown. Even samples amplified with sufficient amounts of DNA show some normal variation in peak heights (see Figure 3).
- the loss of some alleles (the extreme case of peak height “imbalance”) for one or more sources at a locus (termed “allele drop-out”) or the loss of all alleles at a locus (termed “locus drop-out”) due to the small amount of DNA present. The uncertainty regarding whether a complete or partial DNA profile is present may affect the ability to: a) determine if the source(s) of DNA are homozygous or heterozygous at a locus; b) associate genotypes across loci; and c) accurately estimate the minimum number of DNA sources in the mixture.
- the presence of additional peaks labeled as alleles that are not from the original sources (termed “drop-in”). These peaks may be due to several different possibilities (e.g., increased stutter peak height due to the production of stutter peak products in early amplification cycles, other random artifacts of amplification, electrophoresis, detection and/or analysis that cannot be distinguished from true alleles, or low levels of sporadic contamination of one or a few DNA templates or products introduced anywhere in the process), and can lead to overestimation of the minimum number of sources to the DNA profile and the possible risk of false-inclusion of an individual.
 Figure 3. Peak height imbalance.
Three replicate aliquots of 1ng of a single-source DNA from a combined DNA plus master mix solution was amplified with the Applied Biosystems Identifiler® kit. One microliter was injected for 2 seconds on an Applied Biosystems 3130 Genetic Analyzer, and the data were analyzed using GeneMapper® ID-X. All variation in peak heights and peak height imbalance is due to variability in amplification, pipetting and electrokinetic injection.
From the data alone, it is reasonable to assume that the profile in Figure 1 does not suffer any stochastic effects and thus contains all alleles from the contributing sources based on the peak heights present. If all alleles from a known individual are present in this mixture, then that individual is included as a possible source. In contrast, the absence in this mixture of one allele (and certainly more) that is present in the profile from a known individual warrants excluding the individual as a source. However, the minor source of DNA in Figure 2 has some alleles with lower peak heights that may be near or below the stochastic threshold, introducing some possibility that the profile may be incomplete. In addition, some unlabeled stutter peaks at similar heights to the detected minor alleles also may need to be considered in the interpretation and statistical calculations. Restricting genotypes for a single minor contributor is simple at a few loci (e.g., TH01, Penta E) but more complex at others (e.g., D18S51, D16S539); restricting genotypes if there were two minor sources of DNA would be impossible.
Where it is difficult to reasonably assume the number of contributors due to shared alleles and/or limiting amounts of DNA with associated stochastic effects, it is important to consider the profile under different assumptions when the comparison is made to a known individual’s profile. Caution should be used in declaring that a major source profile is present, as the highest peaks may simply represent the additive effect of alleles shared by two or more of the sources. It may be necessary to report the conclusions using different assumptions (e.g., mixture of two sources vs. mixture of three sources). This is especially true if the conclusions for an individual being compared to the evidence profile change under the different assumptions (e.g., excluded if two sources vs. included or inconclusive if three or more sources of DNA).
Due to the complications inherent in interpretation of partial and/or complex mixed DNA profiles, it is imperative that all profiles are thoroughly assessed and that the alleles relied on for interpretation and calculation for statistical frequencies be recorded prior to any comparison to profiles from known individuals. It might be helpful to record (e.g., on a worksheet) any decisions made during the assessment of the profile for reference at a later time (e.g., discussions with technical reviewer, technical leader or attorney(s), or during testimony) and establish the assumptions that may be used during interpretation and reporting. Similarly, determinations that a profile is unsuitable for interpretation and comparison should be made prior to referencing any known profiles. These steps will help ensure that no bias is introduced during the final interpretation process.
The DNA tests that we routinely use in our laboratories are designed to be exclusionary tests. That is, testing is performed under the premise that an individual who is not the source of the DNA with a single-source profile or who is not one of the sources in a mixture of DNA is expected to be excluded from the DNA sample. This premise holds true when a complete multi-locus single-source profile is obtained. However, as the number of sources in a mixture increases along with the concomitant increase in the number of alleles to interpret, and as the relatedness of a non-source to a true source increases, the ability to exclude a falsely accused individual decreases. The statement of “inclusion” under these scenarios may have little meaning, and the frequency of the mixed DNA profile results may be quite common. “Inconclusive” or “insufficient for comparison purposes” may be the more appropriate conclusion in some cases.
Similarly, as the quality of a DNA profile decreases (e.g., partial profile) the number of loci available for interpretation also decreases with the concomitant increase in the number of inconclusive loci, and again, the ability to exclude a falsely accused individual decreases. Fortunately, the statistical significance of the inclusion decreases proportionally; however, caution should always be used to ensure that strict guidelines for inclusion vs. exclusion (and inconclusive) are followed. Statements of inclusion and exclusion have powerful ramifications in our justice system. Care must be taken to provide all parties (e.g., law enforcement, attorneys for both sides and the judge and jury if the evidence makes it to court) a clear understanding of the limitations of a multiple-source mixture and the meaning of an inclusion or an exclusion for a particular sample in the context of the case. This is especially important when the “match” is a partial inclusion of a partial profile with statistical frequencies that are not rare. The term “cannot be excluded” really means the same as “included”; these statements are synonymous conclusions, and thus, always should be followed by appropriate statistical calculations. When there is a temptation to report “cannot be excluded” instead of reporting that an individual is “included as a (possible) source”, be aware that there is some likelihood that a bias against exclusion or inconclusive and pro-inclusion may be favored. In some cases, either of these statements of non-exclusion can be compelling (and possibly misinterpreted as statements of identification of the source) regardless of the associated statistical frequencies.
For samples where there is an uncertainty regarding the number of DNA sources and whether the profile is partial or complete, mixture interpretation can be difficult and analysts may have differing opinions on how to interpret the data. In this situation, amplifying more DNA and/or extracting DNA from other regions of the item or from separate items in the case may prove beneficial.
There is an extensive list of publications relevant to DNA mixture interpretation in forensic cases (1,2). These studies may be used by forensic laboratories in conjunction with well-designed and carefully reviewed internal validation studies to establish effective standard procedures for DNA-testing parameters and their appropriate associated mixture-interpretation policies. Sensitivity studies and mixture studies covering all ranges of DNA tested under all parameters in the laboratory can provide a strong foundation to the laboratory for assessing the range of peak height ratios and stutter percentages routinely observed in the laboratory and for establishing appropriate analytical and stochastic thresholds for data analysis along with rigorous guidelines for consistent profile interpretation and statistical frequency calculations. Casework profile data using samples from known individuals may be used to enhance the established procedures by providing valuable perspectives on the limitations and parameters of DNA mixture interpretations. These measures, used in tandem with a comprehensive analyst training program, help ensure interpretation and reporting consistency throughout a laboratory. This is turn results in neutral, reproducible and accurate interpretation of the available DNA profile data.
Acknowledgments
Thank you to Martin Ensenberger of Promega Corporation and to Dr. Robin Cotton of Boston University for generously providing the profiles for the figures, and to Todd Bille, John Butler, Mike Coble, Robin Cotton and Catherine Grgicak for very helpful discussions on mixture interpretation.
References
- SWGDAM (2010). SWGDAM interpretation guidelines for autosomal STR typing by forensic DNA testing laboratories. This can be viewed online at: www.fbi.gov/about-us/lab/codis/swgdam.pdf
- Short tandem repeat DNA internet database. Information on DNA mixture interpretation. This can be viewed online at: www.cstl.nist.gov/div831/strbase/mixture.htm
How to Cite This Article
Scientific Style and Format, 7th edition, 2006
Word, C.J. Mixture Interpretation: Why is it Sometimes So Hard? [Internet] 2011. [cited: year, month, date]. Available from: https://www.promega.com/resources/profiles-in-dna/2011/mixture-interpretation-why-is-it-sometimes-so-hard/
American Medical Association, Manual of Style, 10th edition, 2007
Word, C.J. Mixture Interpretation: Why is it Sometimes So Hard? Promega Corporation Web site. https://www.promega.com/resources/profiles-in-dna/2011/mixture-interpretation-why-is-it-sometimes-so-hard/ Updated 2011. Accessed Month Day, Year.
Contribution of an article to Profiles in DNA does not constitute an endorsement of Promega products.
PowerPlex is a registered trademark of Promega Corporation.
Products may be covered by pending or issued patents or may have certain limitations. More information.
All prices and specifications are subject to change without prior notice.
Product claims are subject to change. Please contact Promega Technical Services or access the Promega online catalog for the most up-to-date information on Promega products.