Visualize KRAS Protein-Protein Interactions on the GloMax® Galaxy Bioluminescence Imager
Simon Moe, Promega Corporation
Publication date: September 2024
Introduction
If you're used to working with bioluminescence, you’ve probably spent a fair amount of time explaining to others how it works, how it has superior sensitivity to traditional fluorescence assays, and why it’s your go-to method for detecting complex biological processes. But let’s be honest: no matter how impressive the data, there’s always been that lingering question—If the bioluminescent signal is generated through the summation of signal from a well of cells, how accurately does it reflect what's happening in a cell-to-cell basis?
That’s the kind of challenge often faced in the lab, where researchers rely on population-level data that, while valuable, is ultimately an approximation of what’s happening at the cellular level. Enter the GloMax® Galaxy Bioluminescence Imager—a microscope that moves beyond simple numerical reports to offer something needed in the bioluminescent research space: the ability to see protein-protein interactions in real time, at the individual cell level.
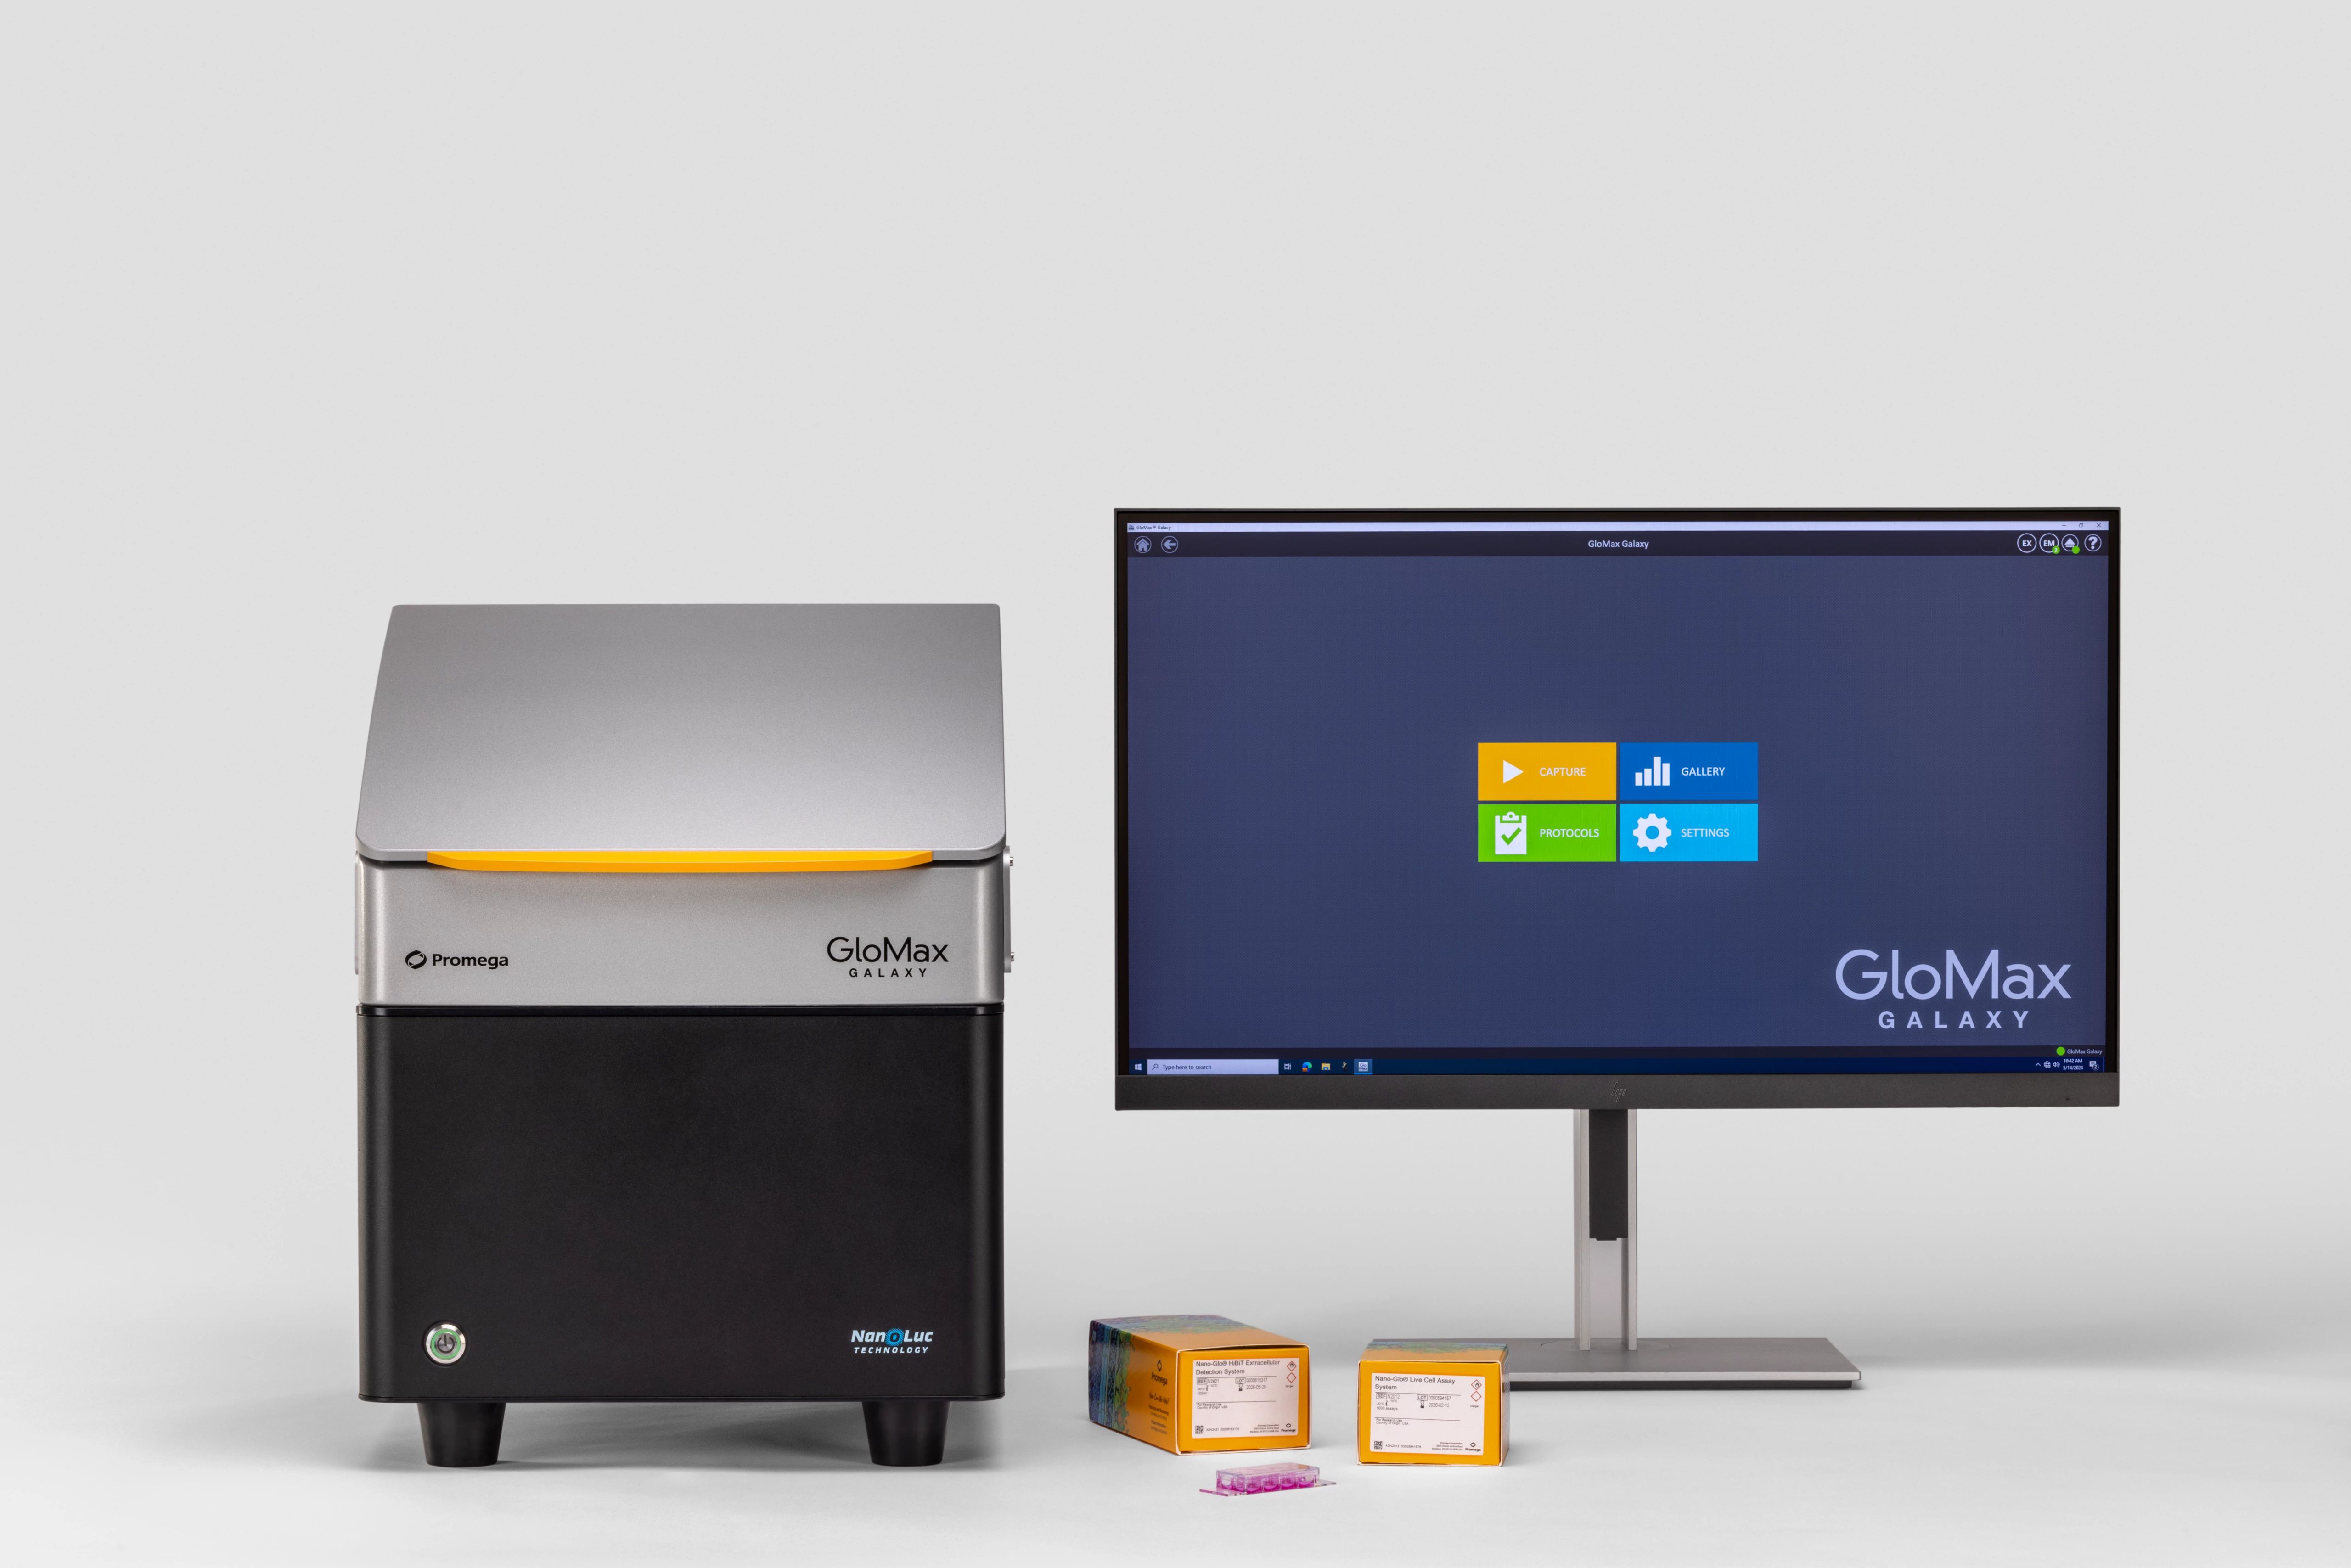
Bioluminescent reporters were traditionally used to monitor gene expression. NanoLuc® has expanded the capabilities far beyond that. By enabling the creation of protein of interest (POI)-reporter gene fusions, NanoLuc® Technologies provides researchers with the means to track protein dynamics—such as localization, degradation, and target engagement—within live cells. However, up until now, visualizing these intricate protein behaviors within a cell population has been a significant hurdle.
With the GloMax® Galaxy, you can finally visualize bioluminescent events as they occur, offering unprecedented insight into cellular dynamics that were once obscured by the limitations of traditional microscopy. In this article, we dive into the real-world application of NanoBRET® technology, using KRAS-CRAF interactions as a model to demonstrate how bioluminescence imaging is opening new doors for understanding protein behavior in live cells.
Using NanoBRET® Technology to Understand Protein-Protein Interactions
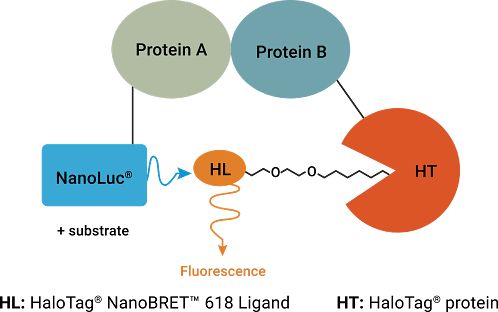
Image KRAS Protein-Protein Interactions
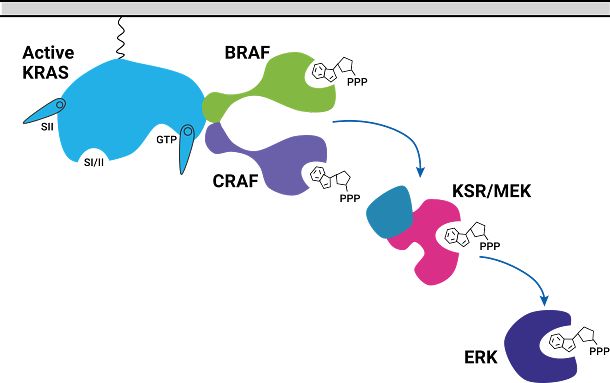
To better understand CRAF, two domains were selected. The RBD (Ras Binding Domain) and CRD (Cysteine Rich Domain) of CRAF were chosen because of their high basal BRET signal when interacting with KRAS. HeLa cells were bulk transfected with NanoLuc-KRAS(G12D) and CRAF-RBD-CRD-HaloTag expressed from a bidirectional promoter (BiBRET), providing consistent long-term interactions between the two proteins.
The transfected cells were plated at a density of 30,000-40,000 cells per well in Ibidi microchambers and incubated overnight to allow for proper attachment and expression. These microchambers were chosen because their increased well depth is ideal for long-term kinetic imaging, providing better conditions for capturing detailed data over time. To visualize the interaction, the cells were labeled with Janelia Fluor® HaloTag® 549 ligand, which allowed us to track fluorescence, while NanoBRET® Nano-Glo® Substrate was added to initiate the bioluminescent signal. Janelia Fluor® HaloTag® dyes were selected due to them producing less background than traditional HaloTag® dyes, which can interfere with accurate imaging.
KRAS Inhibition with MRTX-1133
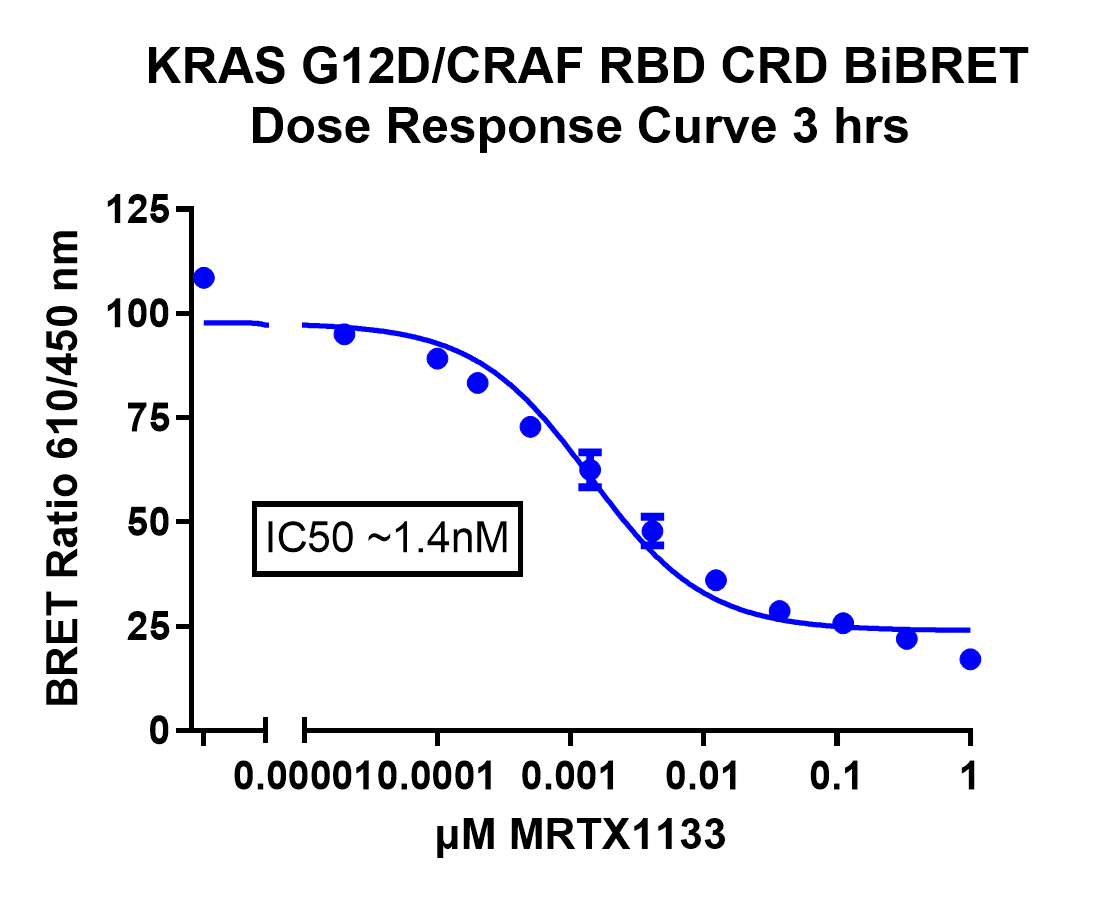
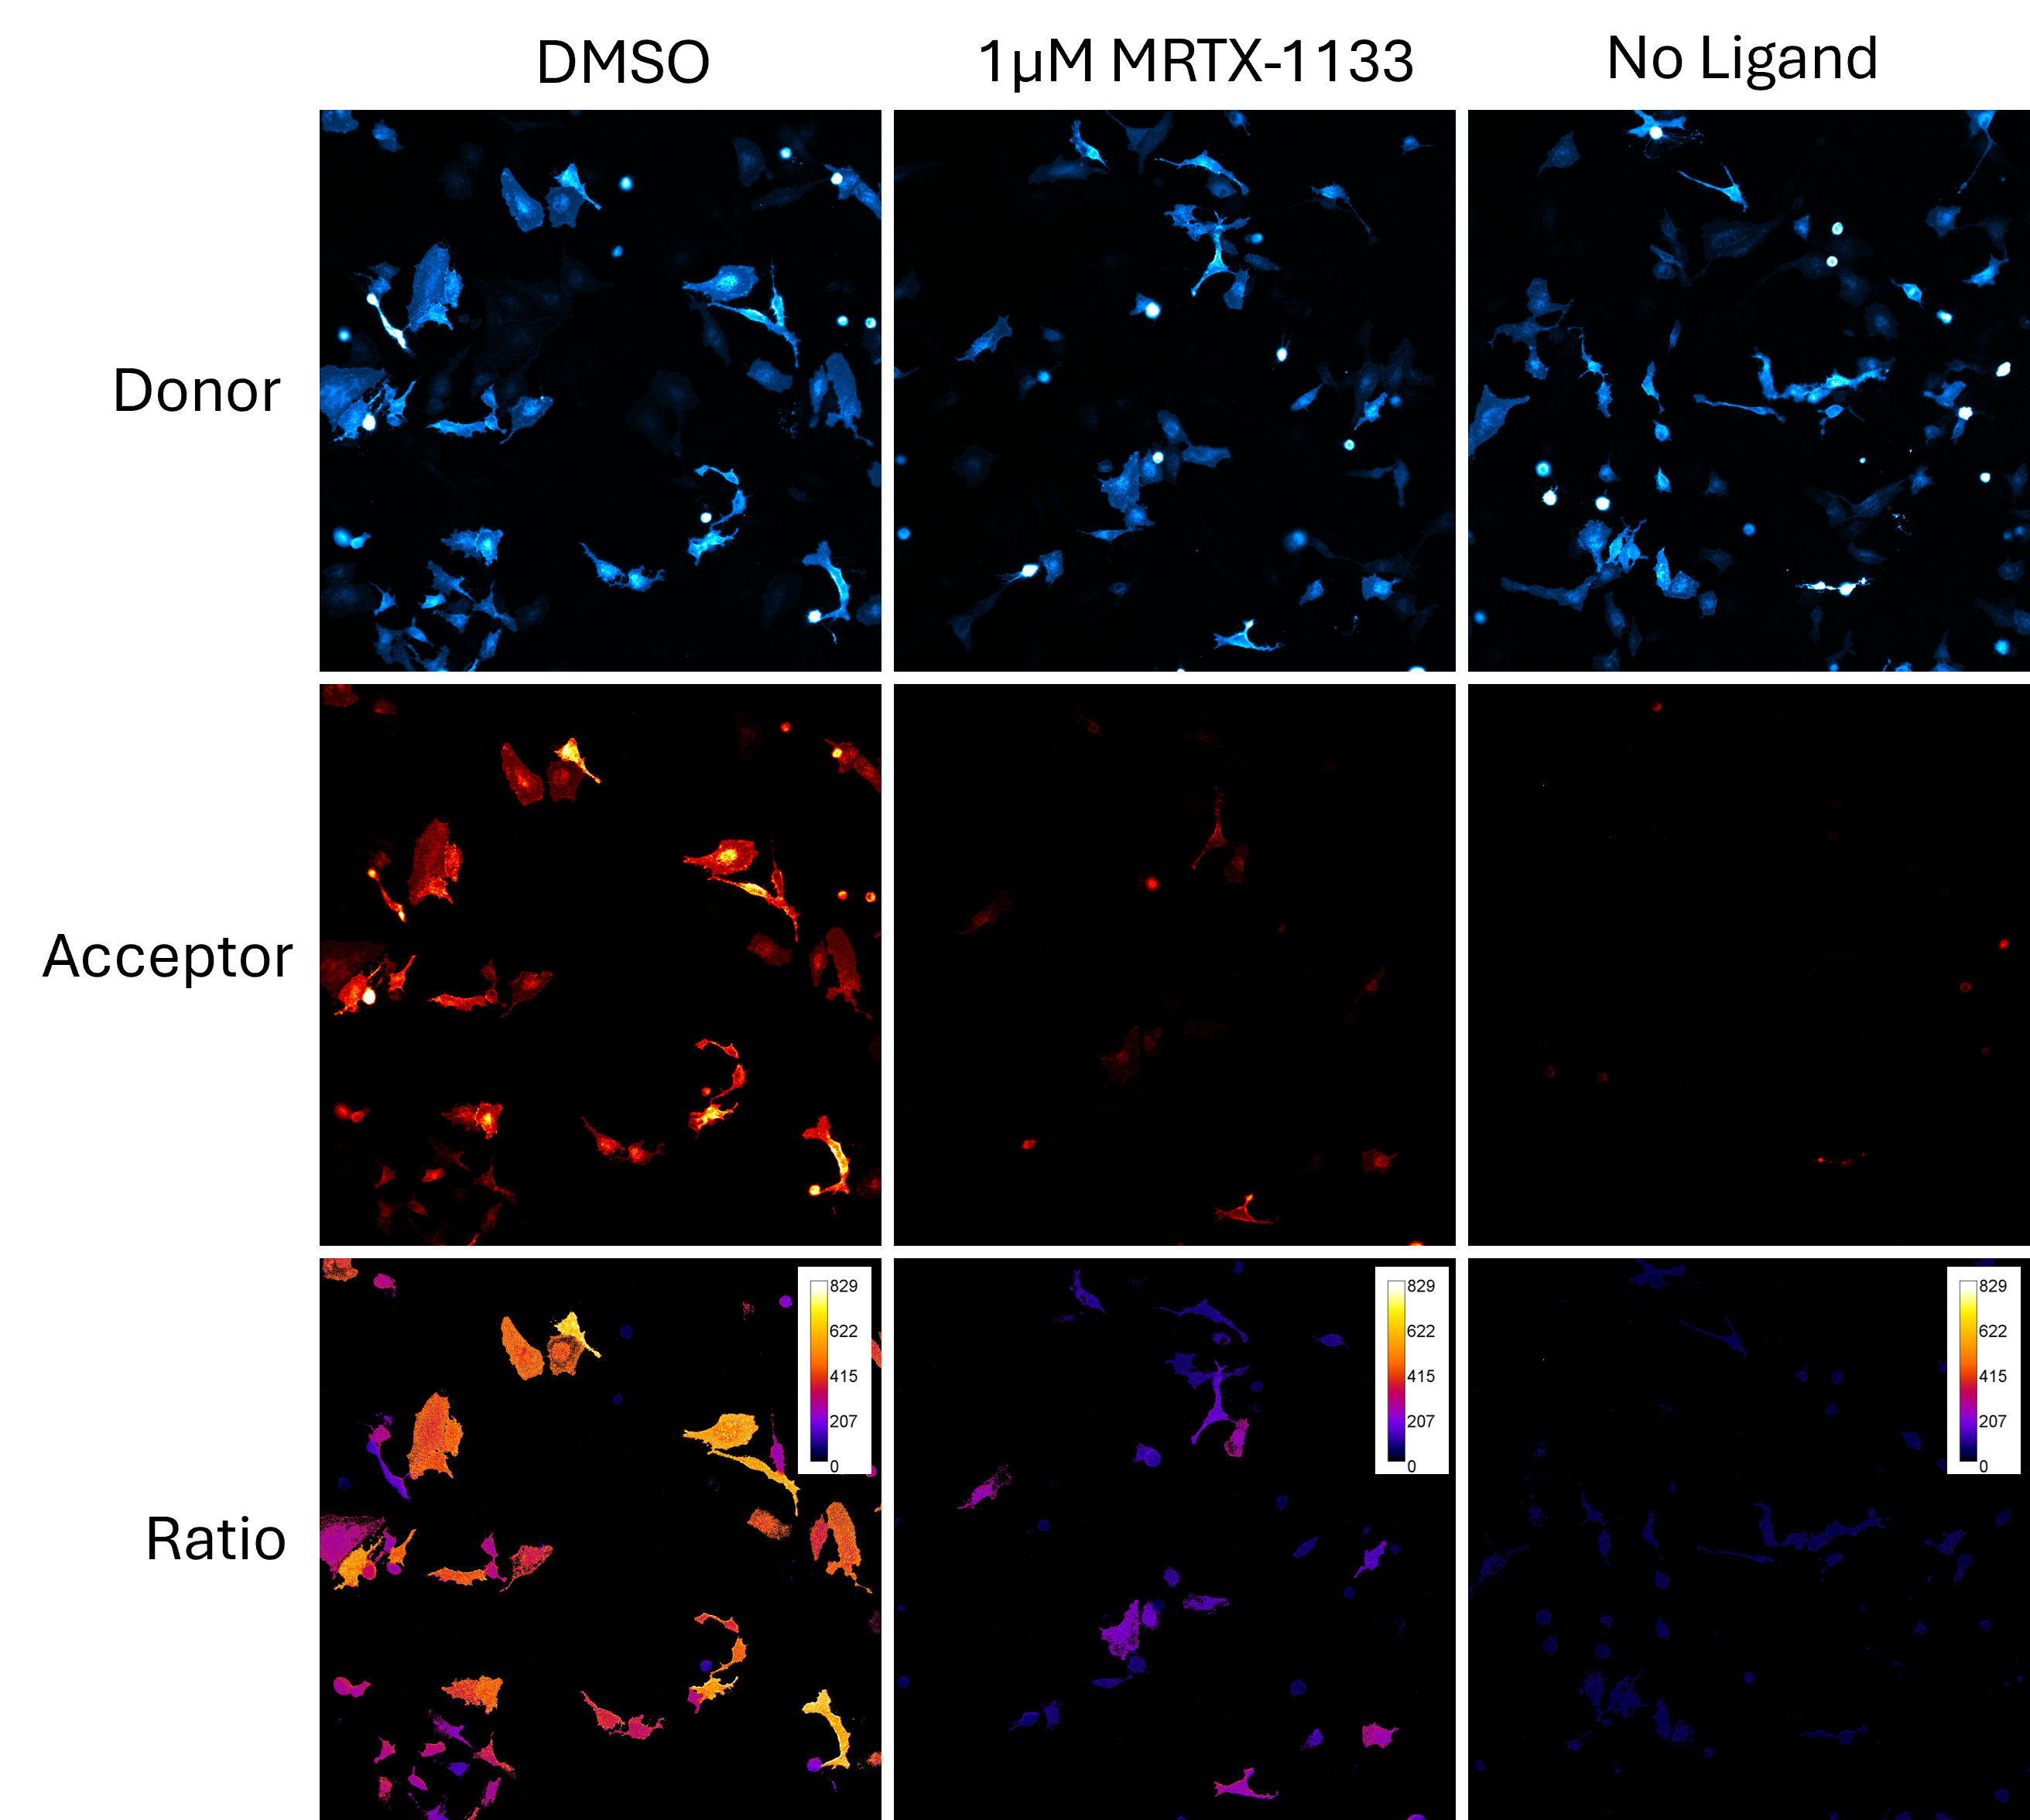
One of the key advantages of using the GloMax® Galaxy is the ability to distinguish between cells based on their individual responses. In this experiment, the imaging system allowed us to analyze the ratio of energy transfer at the single-cell level, providing deeper insights into how each cell responded to MRTX-1133 treatment. For example, some cells do show acceptor signal, suggesting they did not respond to the dose of MRTX-1133 selected. This highlights how subtle differences in cell responses can be missed when taking a snapshot of a global cell population.
This capability offers significant advantages over traditional plate-based assays, which average out signals across a whole cell population. By detecting the signal at the level of individual cells, researchers can discern subtle variations in responses, enabling more detailed analysis of complex biological systems. The ability to measure these interactions visually brings a new dimension to data analysis—moving beyond numerical outputs to actual visualization of protein dynamics.
Conclusion
NanoBRET® technology provides a sensitive method for detecting protein-protein interactions but has historically been difficult to visualize due to limitations in bioluminescent imaging. The GloMax® Galaxy Bioluminescence Imager opens new possibilities to understand complex protein activity through real-time imaging of bioluminescent signals.
The combination of NanoLuc® Technology and the GloMax® Galaxy offers unparalleled sensitivity, spatial resolution, and insight into cellular processes providing a way to tease apart the numbers generated on a plate reader. This expands the possibilities to view protein-protein interactions as they occur in real-time, improving workflows and increasing confidence in a numerical report by providing visualization of actual cellular events.
What does this mean for the lingering question? The answer is clear. Tools like the GloMax® Galaxy will play an essential role in bridging the gap between quantitative data and visual insights, continuing to drive disease and therapeutic discovery.
To learn about the GloMax® Galaxy Bioluminescence Imager, visit the Product Page.
Citations
- Cseh, B., et al. (2014). “rAF” neighborhood: Protein-protein interaction in the Raf/Mek/Erk pathway. In FEBS Letters (Vol. 588, Issue 15, pp. 2398–2406). Elsevier. https://doi.org/10.1016/j.febslet.2014.06.025
- Wang, X., et al. (2022). Identification of MRTX1133, a Noncovalent, Potent, and Selective KRASG12DInhibitor. Journal of Medicinal Chemistry, 65(4), 3123–3133. https://doi.org/10.1021/acs.jmedchem.1c01688
Learn More
The GloMax® Galaxy Bioluminescence Imager is designed for live cell imaging of NanoLuc® Technologies, including HiBiT, NanoBiT®, and NanoBRET®.
Related Resources
Shop our RAS-RAF Pathway Assays
The RAS-RAF pathway is one of the most heavily mutated pathways in cancers, making this pathway an attractive target for drug development. Here you can find assays to probe the binding and activity of compounds against the components of this pathway.
Live-Cell Imaging
Learn more about live cell imaging with bioluminescent tools, including our wide range of NanoLuc® Luciferase technologies.